

What Up E!!!
Talking About Our 'E', Earnings!

What Up E!!!

One of the perks of using pop culture references in our write ups is that we get (and often need – call it due diligence!) to re-watch the movie, episode, or scene that we’re using to illustrate our point of view. Fortunately, Seth Green’s cameo appearance and signature line from HBO’s Entourage popped into my head while performing year end attribution analysis, and I immediately watched the episode. I had forgotten just how entertaining and distracting Entourage was back in the day until Porter reminded me how it had been our Monday morning ritual to recap the most recently aired episode. Seth, who plays the ‘Sherpa’, a fictional version of himself, was the perfect chief adversary to Vinny Chase’s best friend and manager, Eric Murphy, better known as ‘E’. Seth’s signature line, ‘What Up E!!’ was so obnoxious and condescending even a priest would bless the ass kicking he so deserved.
The reason for my serendipitous conjuring was the frequency with which the ‘E’, or company earnings trends, determined single stock investment success or failure in 2025. Thankfully, while we have all the available analytical tools at our disposal, if we had to take only one of them on a desert island and continue to pick stocks, we would choose earnings forecasting every day and twice on Sunday. According to Google Gemini (more on Google later), “over periods of a decade or more, fundamentals dominate. The “speculative” component (valuation change) tends to mean-revert to zero, leaving earnings and dividends as the primary engines of returns.” Over a 20-year period, earnings growth has a .90 correlation to a stock’s return on investment.
While nominal earnings growth has long-term significance, the change rate of earnings, particularly relative to consensus expectations, dominates near-term (less than one year) stock performance. Porter likes to call it ‘Earnings Inflection Analysis.’ As we illustrate below, when we forecast a company’s ‘E’ successfully, outsized returns tend to follow.
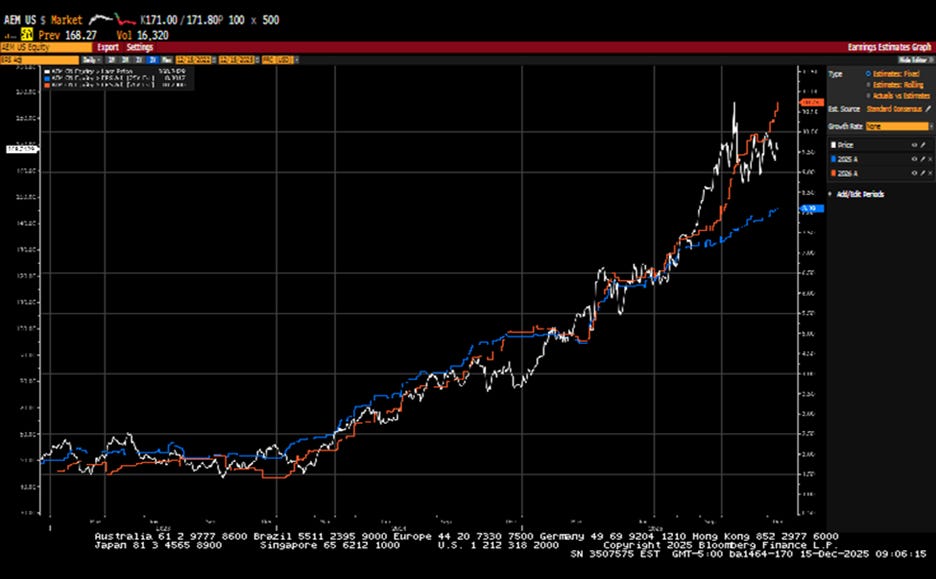
2025 Attribution - Perhaps the best example of ‘earnings trends begetting stock performance’ in 2025 was in gold mining. The below shows the performance of Agnico Eagle Mines (ticker: AEM) relative to the 2025 and 2026 consensus forward expectations over the past two years. As you can see, the correlation between stock performance (the white line) and forward earnings expectation trends (with the blue line representing 2025 expectations and the orange line representing 2026 expectations - this will be the case for each following chart) is quite high. Perhaps master of the obvious but in order for this positive trend to continue, gold prices need to hold firm.
Source: Bloomberg
GEO Group (ticker: GEO), which owns private prisons and provides detention services for the U.S. and state/local government agencies, sits on the negative side of our ledger. Our positive theory for this stock was based on increased utilization rates of their assets resulting from Trump’s robust immigration policies. So far, as seen in the next chart, our theory has not materialized, and earnings expectation trends, particularly 2026 earnings expectations, have declined over the past year. Not surprisingly, the stock has followed suit.
Source: Bloomberg

When analyzing popular shorts such as Palantir (ticker PLTR) and Carvana (ticker CVNA), we use Earnings Inflection Analysis to keep up our bearish tendencies in check.
